Info Graphics.
Across this body of work, I designed a series of infographics to translate complex educational research, instructional models, and environmental science concepts into engaging, accessible visuals for diverse audiences—including educators, students, researchers, and policymakers.
Each piece combines clear layout structure, purposeful visual hierarchy, and curated or original illustrations to support core ideas. Whether modeling professional learning cycles, visualizing STEM identity development, or depicting ecological systems, I focused on clarity, usability, and visual storytelling—crafting graphics that support both research dissemination and real-world application.
STEM Teacher Pathways and Impact.
I led the conceptual development and layout design of these infographics to visualize the long-term impact of STEM teachers on student success and societal outcomes. Working from research findings, I shaped the narrative structure and selected iconography to clearly communicate complex ideas in a compelling, accessible format.


STEM Identity and SciGirls Strategies.
I designed and illustrated this infographic for a science education journal article and outreach materials. It distills research-based strategies that support girls in developing a strong STEM identity—centering inclusivity, cultural responsiveness, and real-world connections. All illustrations and layout were created to clearly communicate each strategy while making the content approachable and engaging for educators and stakeholders.

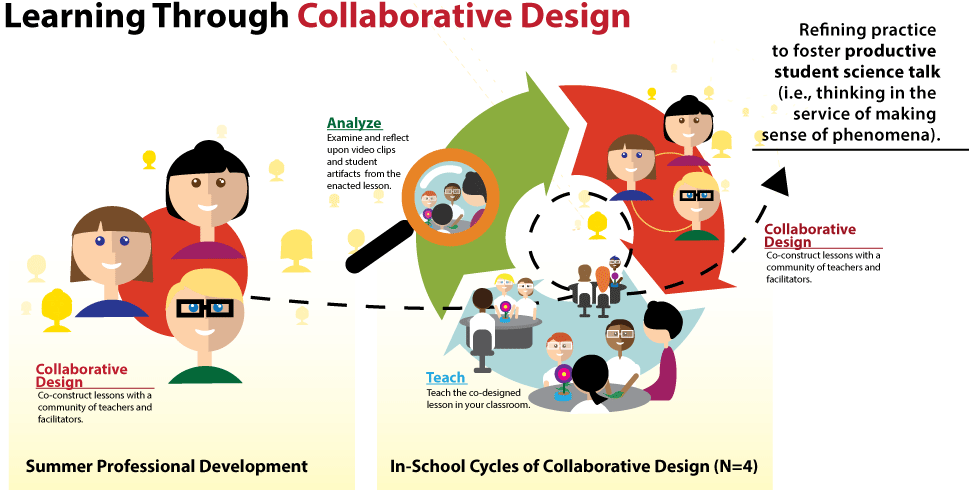
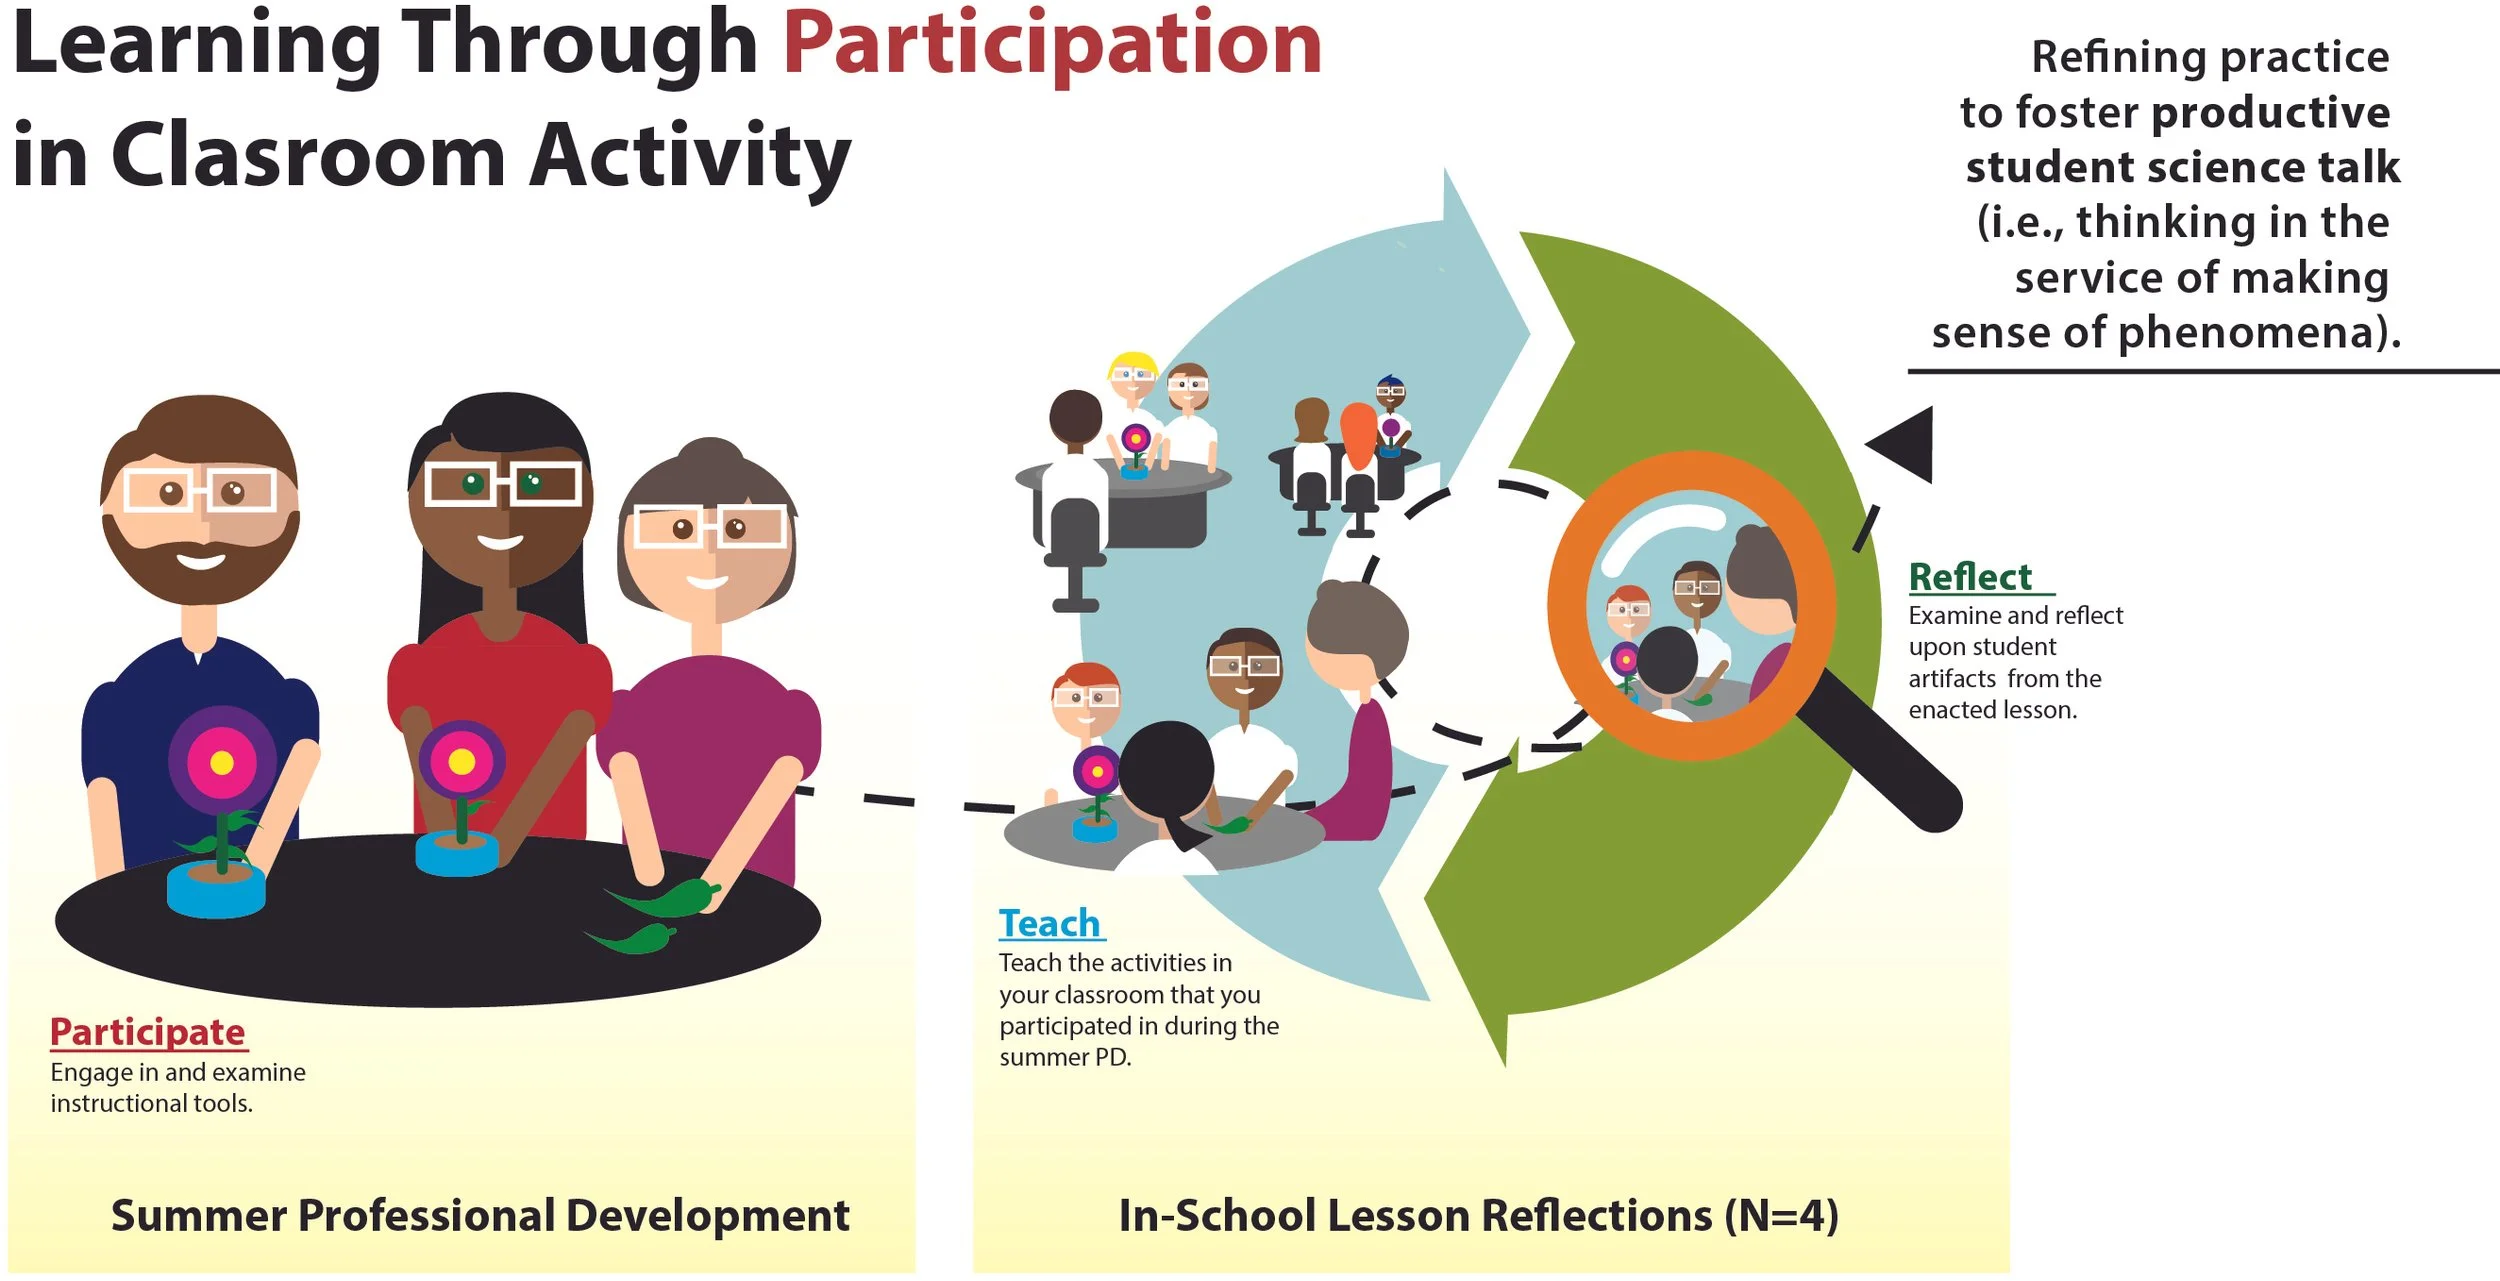
Visualizing of Professional Learning.
This series of infographics communicates research-based models of STEM professional learning, highlighting collaborative design, classroom enactment, and productive student talk. Designed for use in journal articles, presentations, and PD materials, each piece illustrates key phases of teacher learning—from summer institutes to iterative in-school cycles.
I created all illustrations and layouts to clarify complex pedagogical ideas through accessible, engaging visuals. The cohesive design language emphasizes reflection, co-construction, and the use of student thinking and evidence to refine instruction. These graphics bridge research and practice, supporting educator understanding and implementation.


Ecosystem Structures.
This infographic highlights the biodiversity and ecological role of hardbottom reefs in Florida’s Apalachee Bay. I created the full layout and illustrations to translate marine science concepts—like filtration, shelter, and species interdependence—into an engaging visual format for public and educational use. Designed to support environmental outreach, the piece combines vibrant visuals with clear, accessible text to foster awareness of reef ecosystems.

CO2 Levels in Aquatic Environments.
This infographic highlights the ecological role of hardbottom reefs in Florida’s Apalachee Bay. I created the illustrations and layout to visualize how reef organisms support filtration, biodiversity, and habitat, making marine science concepts engaging and accessible for public and educational audiences.
